
Fidelity’s launch of the Fidelity Digital Interest Token (FDIT) on Ethereum is more than a headline-grabbing move; it’s a signal that the institutional fixed-income landscape is undergoing a fundamental transformation. With Ethereum trading at $3,875.35 as of November 2025, the intersection of blockchain technology and traditional asset management is no longer theoretical. Fidelity, one of the world’s largest asset managers, has brought U. S. Treasuries directly onto public blockchain rails, an innovation that could reshape how institutions access, transfer, and manage sovereign debt exposure.
Fidelity Digital Interest Token: Structure and Market Impact
The FDIT represents shares in Fidelity’s Treasury Digital Fund (FYOXX), each token fully backed by U. S. Treasuries and cash equivalents held in custody by Bank of New York Mellon. This isn’t just a digital IOU; it’s a regulated, transparent instrument designed for institutional-grade compliance and risk controls. The tokens are issued as ERC-20 assets on Ethereum, enabling 24/7 operational access and programmable settlement.
With over $200 million in assets under management shortly after launch, FDIT immediately became one of the largest onchain fixed-income vehicles globally. Notably, two holders currently control the entire token supply, underscoring how early-stage adoption is concentrated among sophisticated players but also hinting at future distribution potential as secondary markets mature.
This move places Fidelity in direct competition with BlackRock’s BUIDL fund (over $2.2 billion AUM), highlighting how blue-chip asset managers are racing to capture share in the rapidly growing tokenized Treasury market, which now exceeds $7 billion. The annual management fee for FDIT is set at 0.20%, aligning with traditional money market products but offering distinctly digital advantages: real-time settlement, fractional ownership, and transparent on-chain auditability.
Onchain Fixed-Income: Transparency, Liquidity, and Efficiency
The appeal for institutions goes beyond novelty. By leveraging Ethereum’s infrastructure, FDIT eliminates many legacy frictions, manual reconciliations, delayed settlements, and costly intermediaries become relics of the past. Investors can view their holdings transparently on-chain while benefiting from instant transferability between compliant wallets at any hour.
This operational efficiency is particularly compelling for treasurers managing global liquidity or collateral needs across time zones, a use case that traditional custodians simply cannot match with current systems.
Ethereum Technical Analysis Chart
Analysis by Cameron Ellis | Symbol: BINANCE:ETHUSDT | Interval: 1W | Drawings: 6
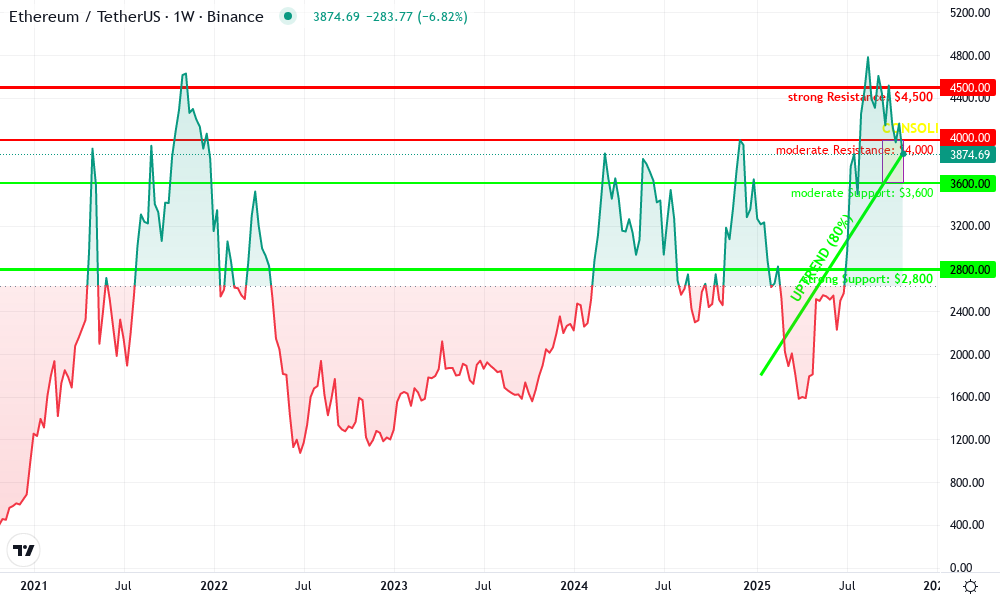
Technical Analysis Summary
Start by drawing a horizontal resistance line at around $4,500 to mark the recent 2025 high, and a horizontal support at $2,800, which has been tested multiple times since mid-2023. Draw an upward trend line from the 2025 low near $1,800 (early 2025) through the higher lows into the current price zone, reflecting the recovery and uptrend. Mark the recent consolidation/sideways action between $3,600 and $4,000 with a rectangle. Highlight the sharp rally from $2,400 to $4,800 (mid-2025) using an arrow_marker or rectangle for price range. Use text/callout to note the impact of Fidelity’s tokenized Treasury fund launch, as this is a significant macro event for ETH. Place a conservative entry zone near recent support ($3,600-$3,800) and a stop-loss zone below $3,200. For exits, reference resistance at $4,500. Emphasize risk management with corresponding stop-loss levels and conservative sizing.
Risk Assessment : medium
The Macro Backdrop: Why Now?
Why are we witnessing this surge in tokenized U. S. Treasuries? The answer lies at the intersection of macroeconomic uncertainty and digital infrastructure maturity. As central banks recalibrate policy rates and sovereign debt issuance remains elevated worldwide, demand for safe-yielding assets like Treasuries has soared among global allocators.
Simultaneously, digital assets have evolved into a distinct investable class; blockchains like Ethereum have proven resilient through multiple market cycles. Institutional confidence has grown accordingly, enough for stalwarts like Fidelity to integrate blockchain rails into their core product offerings.
Ethereum (ETH) Price Prediction & Tokenized Treasury Fund AUM Outlook (2026-2031)
Forecasting ETH price scenarios in the context of institutional adoption and tokenized Treasury fund growth on Ethereum
| Year | Minimum Price (Bearish Scenario) | Average Price (Base Case) | Maximum Price (Bullish Scenario) | Projected Tokenized Treasury Fund AUM (Year-End) | Annual % Change (Avg Price) |
|---|---|---|---|---|---|
| 2026 | $3,200 | $4,400 | $6,200 | $500M | +13.5% |
| 2027 | $3,000 | $5,100 | $8,000 | $1.2B | +15.9% |
| 2028 | $2,800 | $5,900 | $10,500 | $2.5B | +15.7% |
| 2029 | $3,100 | $6,800 | $13,400 | $4.5B | +15.2% |
| 2030 | $3,700 | $7,900 | $17,200 | $7.0B | +16.2% |
| 2031 | $4,300 | $9,200 | $21,000 | $10.5B | +16.5% |
Price Prediction Summary
Ethereum is positioned for sustained growth as institutional participation in onchain finance accelerates, especially with the adoption of tokenized Treasury funds like Fidelity’s FDIT. The base case projects a steady increase in ETH’s average price, buoyed by real-world asset (RWA) tokenization, broader blockchain utility, and increasing fund AUM. However, price volatility remains, with bearish scenarios accounting for regulatory or macroeconomic headwinds, and bullish scenarios reflecting explosive adoption and favorable market cycles.
Key Factors Affecting Ethereum Price
- Institutional adoption of tokenized assets (e.g., Fidelity, BlackRock) driving onchain activity and demand for ETH.
- Expansion of real-world asset (RWA) tokenization, increasing Ethereum’s utility and transaction volume.
- Potential for regulatory clarity or new frameworks in the U.S. and globally, impacting both ETH price and fund growth.
- Ethereum network upgrades (scalability, security, staking) enhancing value proposition versus competitors.
- Macro market cycles, including crypto bull/bear phases and global economic conditions.
- Competition from alternative L1 blockchains or tokenization platforms.
- Integration of traditional finance (TradFi) infrastructure with DeFi, catalyzing further institutional entry.
Disclaimer: Cryptocurrency price predictions are speculative and based on current market analysis. Actual prices may vary significantly due to market volatility, regulatory changes, and other factors. Always do your own research before making investment decisions.
Cryptocurrency Price Comparison: FDIT vs BUIDL vs OUSG (6-Month Performance)
Side-by-side comparison of Fidelity Tokenized U.S. Treasuries Fund (FDIT), BlackRock USD Institutional Digital Liquidity Fund (BUIDL), and Ondo US Government Bond Fund (OUSG) over the past six months, with major crypto benchmarks for context.
| Asset | Current Price | 6 Months Ago | Price Change |
|---|---|---|---|
| Fidelity Tokenized U.S. Treasuries Fund (FDIT) | $1.00 | $1.00 | +0.0% |
| BlackRock USD Institutional Digital Liquidity Fund (BUIDL) | $0.001197 | $0.001197 | +0.0% |
| Ondo US Government Bond Fund (OUSG) | $113.13 | $113.13 | +0.0% |
| Bitcoin (BTC) | $109,944.00 | $60,000.00 | +83.2% |
| Ethereum (ETH) | $3,872.70 | $2,488.00 | +55.6% |
| Tether (USDT) | $1.00 | $1.00 | +0.0% |
| USD Coin (USDC) | $0.0336 | $0.0336 | +0.0% |
| Grayscale Bitcoin Trust (GBTC) | $65.16 | $65.16 | +0.0% |
Analysis Summary
Over the past six months, tokenized treasury funds such as FDIT, BUIDL, and OUSG have maintained stable prices, reflecting their underlying fixed-income nature. In contrast, major cryptocurrencies like Bitcoin and Ethereum have experienced significant growth, while stablecoins and trust products have remained steady.
Key Insights
- FDIT, BUIDL, and OUSG all showed zero price change over six months, underscoring their stability as tokenized fixed-income products.
- Bitcoin and Ethereum saw substantial gains (+83.2% and +55.6% respectively), highlighting the volatility and growth potential of major cryptocurrencies compared to tokenized funds.
- Stablecoins (USDT, USDC) and the Grayscale Bitcoin Trust (GBTC) also remained stable, consistent with their respective mandates and structures.
- The stability of tokenized treasury funds demonstrates their suitability for investors seeking on-chain exposure to traditional fixed-income assets without the volatility of crypto markets.
All prices and percentage changes are sourced directly from the provided real-time market data as of 2025-11-01. No estimates or external data were used; only the exact figures supplied above are included in this comparison.
Data Sources:
- Main Asset: https://www.coingecko.com/en/coins/fidelity-tokenized-us-treasuries-fund
- BlackRock USD Institutional Digital Liquidity Fund: https://www.coingecko.com/en/coins/blackrock-usd-institutional-digital-liquidity-fund
- Ondo US Government Bond Fund: https://www.coingecko.com/en/coins/ondo-us-government-bond-fund
- Bitcoin: https://www.coingecko.com/en/coins/bitcoin
- Ethereum: https://www.coingecko.com/en/coins/ethereum
- Tether: https://www.coingecko.com/en/coins/tether
- USD Coin: https://www.coingecko.com/en/coins/usd-coin
- Grayscale Bitcoin Trust: https://www.coingecko.com/en/coins/grayscale-bitcoin-trust
Disclaimer: Cryptocurrency prices are highly volatile and subject to market fluctuations. The data presented is for informational purposes only and should not be considered as investment advice. Always do your own research before making investment decisions.
This convergence isn’t just about efficiency, it’s about future-proofing capital markets infrastructure against rising complexity and fragmentation in global finance. For more analysis on how this trend impacts institutional investors specifically, see our deep dive here.
As tokenized U. S. Treasuries funds like FDIT mature, the implications for liquidity and market structure are profound. By enabling programmable, on-chain settlement, these products open the door to new forms of collateralization, real-time risk monitoring, and composable financial products. This is particularly relevant for decentralized finance (DeFi) protocols and digital-native hedge funds seeking secure yield without sacrificing transparency or operational agility.
Moreover, the presence of traditional custodians such as Bank of New York Mellon ensures that these innovations remain anchored to regulatory best practices. This hybrid approach - combining blockchain’s efficiency with established oversight - is likely to set the standard for future institutional offerings. The 0.20% management fee reflects a competitive stance in an environment where cost pressures and demand for transparency are mounting across asset management.
Challenges Ahead: Distribution and Secondary Markets
Despite its promise, FDIT’s current concentration among just two holders highlights a key challenge: broadening access while maintaining compliance. For now, most secondary trading occurs off-chain or via permissioned venues, limiting retail participation and liquidity depth compared to traditional ETFs or mutual funds. However, as standards for tokenized treasury compliance evolve and on-chain KYC/AML solutions mature, wider distribution will likely follow.
This transition phase mirrors early ETF adoption in the 2000s: initial concentration among institutions gave way to broader accessibility as infrastructure matured and regulatory clarity improved. Expect similar dynamics in tokenized bonds and treasuries over the coming years.
The Bigger Picture: Institutional Adoption and Market Integration
The rapid growth of tokenized treasury products is not occurring in isolation. BlackRock’s BUIDL fund, Ondo’s OUSG anchor investments, and now Fidelity’s FDIT all signal a shift in how large allocators think about fixed-income exposure. These offerings are not just digital wrappers - they represent a fundamental retooling of how sovereign debt can be issued, traded, and settled.
If successful at scale, this could catalyze further integration between public blockchains like Ethereum (currently priced at $3,875.35) and traditional finance rails. Over time, we may see central banks or sovereign wealth funds directly interacting with on-chain liquidity pools or using smart contracts for automated repo operations.
For those tracking this evolution closely - from institutional allocators to crypto-native treasurers - Fidelity’s entry marks a watershed moment in bridging compliance-driven capital with programmable finance. The next phase will hinge on distribution innovation and regulatory harmonization across jurisdictions.
For more macro-focused analysis on the strategic implications for institutional investors navigating this shift, visit our comprehensive resource here.
Tags
Related Articles

Ondo USDY Tokenized US Treasuries Live on Sei Network: High-Speed Yield for DeFi Users
Ondo Finance's USDY tokenized US Treasuries have gone live on the Sei Network, delivering institutional-grade yield at a blistering pace tailored for DeFi power users. Trading at $1.11 with a 24-hour gain of and $0.0100 ( and 0.91%), USDY...
Feb 23, 2026
Ondo USDY Launches on Sei Network: Unlocking Tokenized U.S. Treasuries for High-Speed DeFi Lending
Ondo Finance just dropped a game-changer on the Sei Network: USDY, their flagship yield-bearing tokenized U. S. Treasury product, is now live. Trading at a steady $1.11 , with a 24-hour high of $1.12 and low of $1.04 , this launch fuses...
Feb 20, 2026
Ondo USDY Tokenized Treasuries Live on Sei Network: Unlocking High-Speed DeFi Lending and Collateral
In a world where traditional finance meets blockchain's relentless pace, Ondo Finance's USDY tokenized treasuries have gone live on the Sei Network, blending short-term U. S. Treasuries and bank deposits into a yield-bearing powerhouse for...
Feb 16, 2026
Ondo USDY Tokenized US Treasuries Launches on Sei Network for Faster DeFi Lending
Ondo Finance has just deployed its flagship USDY tokenized US treasuries on the Sei Network, unlocking faster DeFi lending opportunities for global investors. Trading at a robust $1.11 with a 24-hour gain of and $0.0300 ( and 2.78%), USDY...
Feb 15, 2026
No comments yet. Be the first to share your thoughts!