Fidelity’s quiet but powerful entry into the tokenized U. S. Treasuries market isn’t just another digital experiment. It’s a strategic signal that the institutional adoption of blockchain has entered a new phase of maturity. With the launch of the Fidelity Digital Interest Token (FDIT) on Ethereum, over $200 million in short-term U. S. Treasuries and money-market assets have already been brought on-chain, giving legacy finance a new playbook for liquidity, transparency, and settlement efficiency.
Ethereum (ETH) Live Price
Powered by TradingView
Trade ETH
Why Fidelity’s FDIT Is More Than Just Another Token
For years, traditional institutions have eyed blockchain with a mix of skepticism and curiosity. Now, with FDIT, a tokenized share class of a Treasury money market fund, Fidelity has demonstrated that blue-chip asset managers can leverage Ethereum as a robust settlement layer for real-world assets (RWAs). This isn’t an isolated move; it marks a tipping point in how institutions perceive on-chain government bonds.
Consider the numbers: Ethereum now dominates the tokenized U. S. Treasury space, controlling 70% of the market with $5.3 billion out of $7.46 billion total value locked in on-chain treasuries. Fidelity’s FDIT alone has issued more than 203 million tokens since launch, a remarkable figure for an asset class that was once considered too slow or cumbersome for blockchain rails.
The implications are profound. By using Ethereum as its infrastructure backbone, Fidelity is not only validating public blockchain security but also making regulated fixed-income products accessible to a global investor base 24/7, without intermediaries or legacy settlement delays.
Institutional Blockchain Adoption Accelerates
The FDIT launch comes amid an institutional gold rush into tokenized assets. According to recent data, 60% of Fortune 500 companies are actively developing blockchain projects, a statistic that would have been unthinkable just five years ago. The maturation of digital assets is no longer theoretical; it’s showing up in balance sheets and product roadmaps across Wall Street.
This shift is about more than technology; it’s about capital efficiency and risk management. Tokenized US Treasuries like FDIT offer programmable compliance, real-time auditability, and atomic settlement, capabilities that traditional systems struggle to match at scale.
Julian Mercer is a seasoned fixed income trader with 15 years on Wall Street and a recent focus on blockchain-based debt instruments. He leverages a blend of technical analysis and macroeconomic insight to uncover value in both traditional and tokenized bonds. Julian’s pragmatic yet innovative perspective helps clients adapt to the digital transformation of fixed income. “Adapt or be left behind” is his guiding principle.
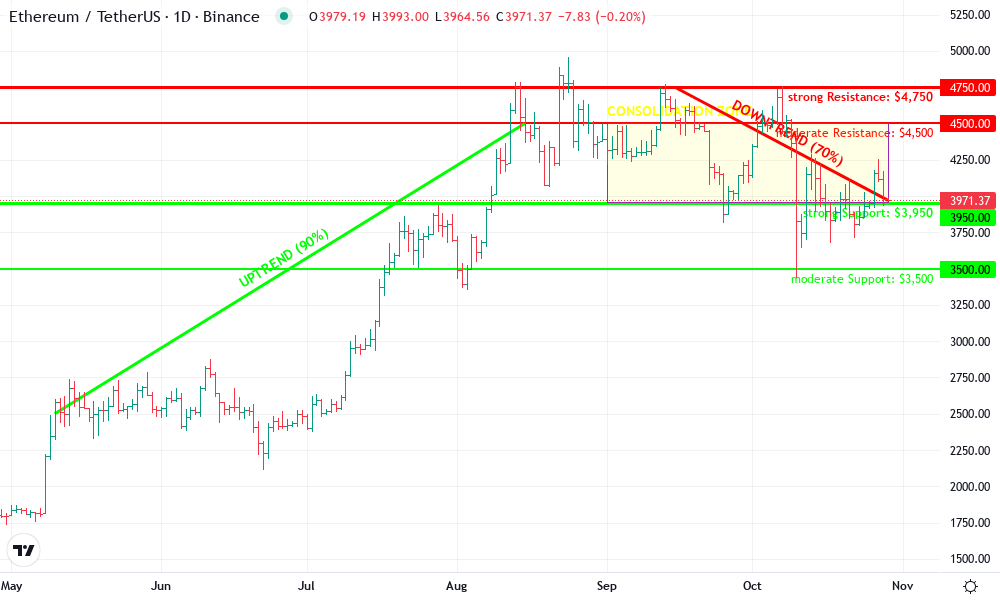
As Julian Mercer, I approach this chart with a hybrid mindset—melding technical structure with broader institutional adoption themes. Ethereum’s price action in 2025 reflects its dual nature: both a risk asset and institutional building block, as evidenced by Fidelity’s tokenized treasury fund launch. The trend since May demonstrates robust inflows likely tied to macro catalysts and the maturing digital bond ecosystem. However, the recent failure to reclaim the $4,500-$4,750 range and a series of lower highs signal market hesitancy, possibly reflecting a pause for digestion after a historic run. The $3,950 zone is critical: it’s both a technical and psychological level, and sustained closes below could trigger a deeper retrace to $3,500. I would be patient here, respecting the consolidation and letting the market reveal its hand—adaptation is key, as always.
Technical Analysis Summary
Start by mapping the major uptrend from late May 2025 through August 2025 using a trend_line, capturing the steep climb from the $2,500 zone to above $4,500. Next, draw a horizontal resistance line at $4,750, which marks the recent swing highs of September and October 2025. Place a horizontal support line around $3,950, which is acting as a pivotal zone in late October 2025. Identify the consolidation range between $3,950 and $4,500 since September using a rectangle to highlight the current indecision. Mark key entry zones near $3,950 (support retest) and exits around $4,500 (upper range resistance) with long_position and short_position tools for trade simulation. Use a callout for the sharp dip and recovery in early October, likely associated with market news or event-driven volatility. Annotate potential risk zones with text and arrow_marker for clarity.
Risk Assessment: medium
Analysis: The market is digesting a major move, with price trapped in a broad consolidation. While institutional flows are a tailwind, failure to hold $3,950 could spark further downside, but upside is capped at $4,500-$4,750 until fresh catalysts emerge.
Julian Mercer’s Recommendation: Remain patient and tactical—watch for a clear break from this range before increasing exposure. Respect stop losses and be ready to adapt to new themes as institutional adoption continues to evolve.